Slicing and dicing NYC Noise – NYPD Close out time Trends
Number of service requests to NYC’s 311 from 2004 to 2017: 26.99 million
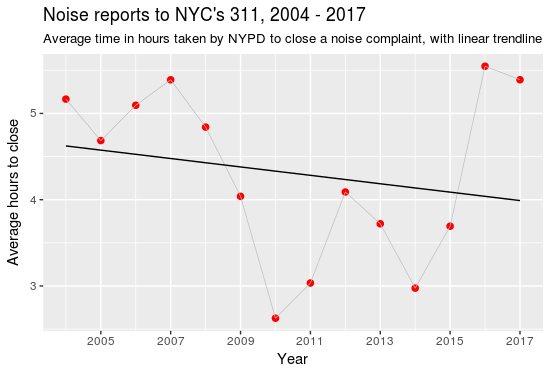
Two posts ago, I plotted the NYPD’s mean time to close which showed a very zig-zaggy line which was begging for a trendline to be plotted through it. The straight line sloping downward below says the long term trend is down – something you couldn’t really tell from just looking at a graph of the annual numbers which were all over the place:

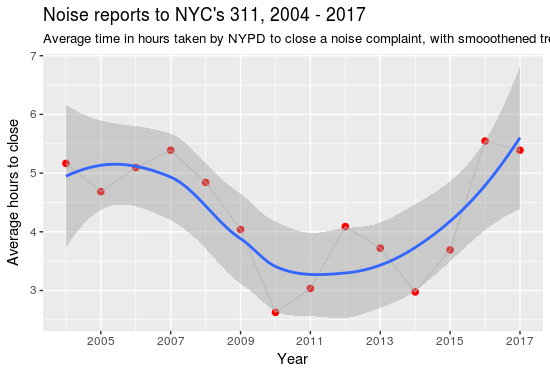
The smoothened line in the next graph looks like it could be the Hudson river, or the Thames, or a bend in any old river… makes for a pretty picture. Any interesting or useful information captured in this? Nothing definitively, beyond the river analogy, but it being close to 4:20 on 4/20 maybe something will pop up after a stroll and some tea. If you see something noteworthy – please leave a comment or tweet me @armipunk


