Covid-19: NYC five borough comparison, cases per 100k Population
Updated 9/24/20 with new graphic at end of post.
On September 12, Mr. Joe Borelli, New York City council member representing a part of Staten Island, put out this tweet:

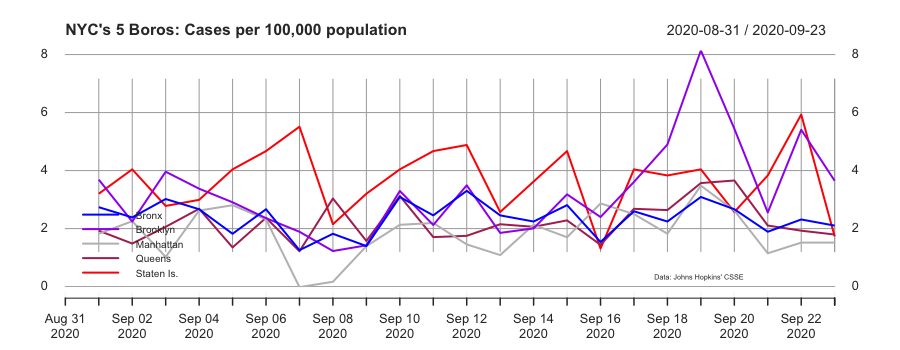
“Awful” is awfully hard to measure. On the other hand, the Covid-19 public health program, months into a pandemic, has been generating a large amount of data. If you scroll back, most of my blog content, till last year, was centered around evidence-based governance, and mapping city services data to council districts became my ‘thing’. Unfortunately, there is no location information with Covid-19 data that makes such district-wise mapping possible. As of September 1, though, Johns Hopkins started reporting by borough/county rather than just NYC as a whole. So I decided to look at the five boroughs and see how much they track each other or diverge from each other.
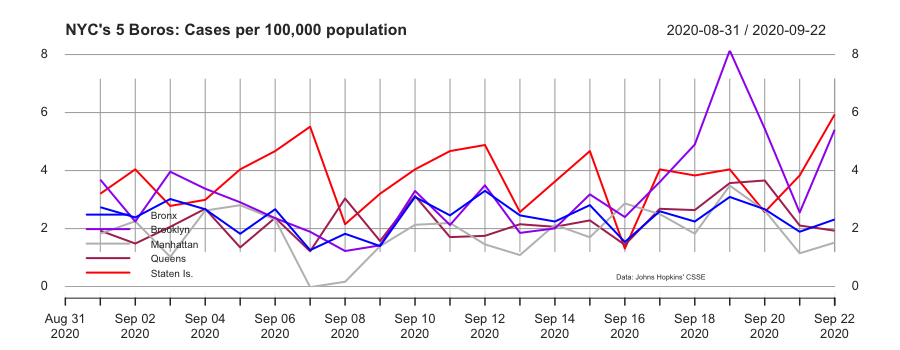
Staten Island has a population of ~476,000 out of NYC’s total population of 8.3 million, and a much lower population density of 8,137 residents per square mile versus New York City as a whole at 27,515 persons per square mile. And yet it leads the five boroughs in transmission. Transmission, we know, that can be reduced by some simple measures. I scanned CM Borelli’s Twitter feed for the last three weeks for messaging to his constituents, and his Twitter followers, about steps to take to avoid getting infected and avoid infecting grandma and killing her without (hopefully) meaning to.
PS: Yes, Brooklyn spiked over the last few days, and remains to be seen, a couple of weeks on, if what we are seeing today is a new trend or a one-time spike.
Added 9/24/20:


