Daily growth rate Covid-19 US & NY

UPDATED: April 24, 2020 21:00h
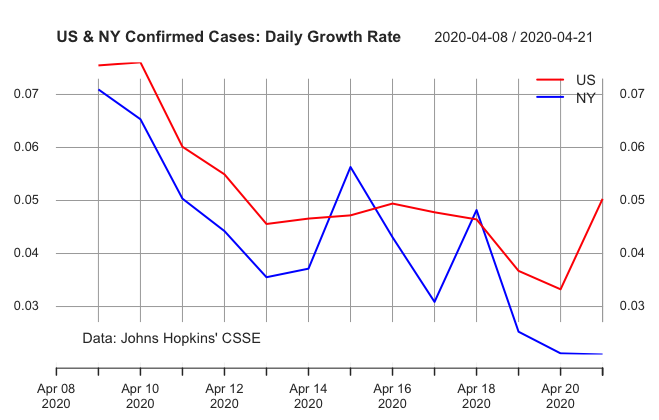
US rate of change in new cases compared to New York state, over the two weeks from April 08 to April 22, based on data from Johns Hopkins University, CSSE.
The graph shows confirmed cases are growing at a slower rate with each passing day. A positive rate of change means there are more new cases today than there were yesterday and what we want is a negative rate of change — fewer cases today than yesterday; and keep going till there are zero new cases. No country has hit that milestone yet. Note that US and NY state begin to diverge from around April 15.

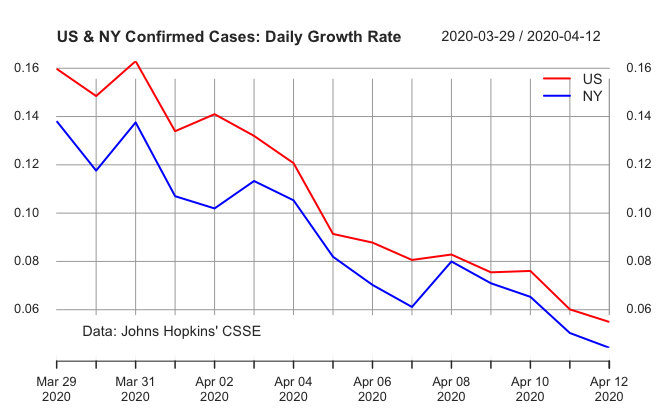
US rate of change compared to New York state, over the two weeks from March 28 to April 12, based on data from Johns Hopkins University, CSSE.
The graph shows confirmed cases are growing at a slower rate with each passing day. A positive rate of change means there are more new cases today than there were yesterday and what we want is a negative rate of change — fewer cases today than yesterday; and keep going till there are zero new cases. No country has hit that milestone yet.


