Covid-19 Daily Cases: NYC Boroughs, Nassau & Westchester Counties
Updated January 17, 2021
Staten Island – in plain English, a resident of SI is almost twice as likely to get infected with the coronavirus than the average New Yorker. (11/23)
Spoke too soon about Staten Island. Looks out of control and as I noted as early as Oct 16, the problem is messaging. Elected officials have to prioritize people’s lives over their partisan political strategies. Trump has done tremendous damage to vast swathes of the country and his acolytes and apologists in the City Council need to mask up and get on board with science. And their Democratic colleagues need to start calling out their anti-maskers colleagues by name. (11/7)
Staten Island finally heading in the right direction, but still a long way to go to get in sync with the rest of NYC. (11/3)
Staten Island keeps widening the gap, with double the rate of new infections as any of the other boroughs. (10/30)
Following graph is a 3-day moving average of new cases, per 100,000 population, by borough. The moving average takes out some of the gyrations in daily numbers that are attributable to reporting quirks. What’s a moving average? Each day’s total on this graph is an average of the most recent three days. All new case counts are stated as cases per 100,000 population so that boroughs with different population sizes can be directly compared.
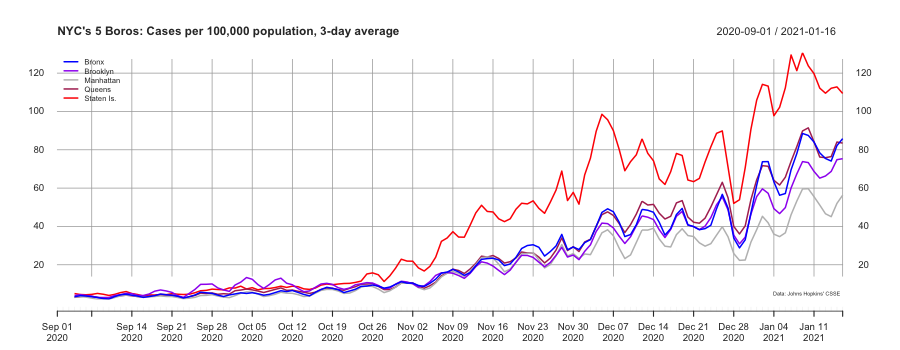
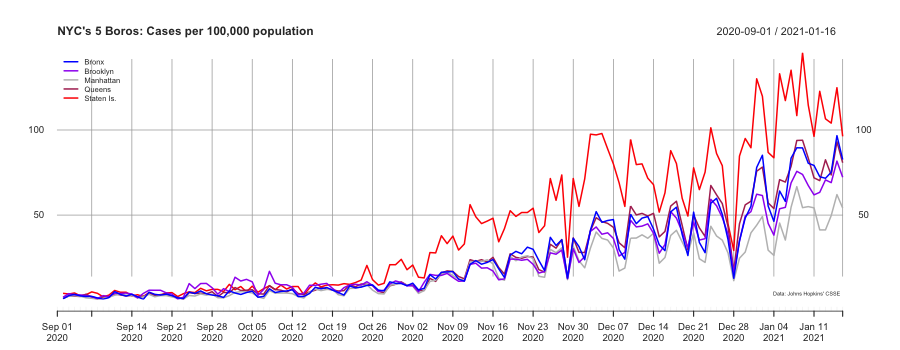
The above was a 3-day average which smoothens the daily gyrations a bit. The next graphic plots new cases each day, no averages, by borough, per 100,000 population..
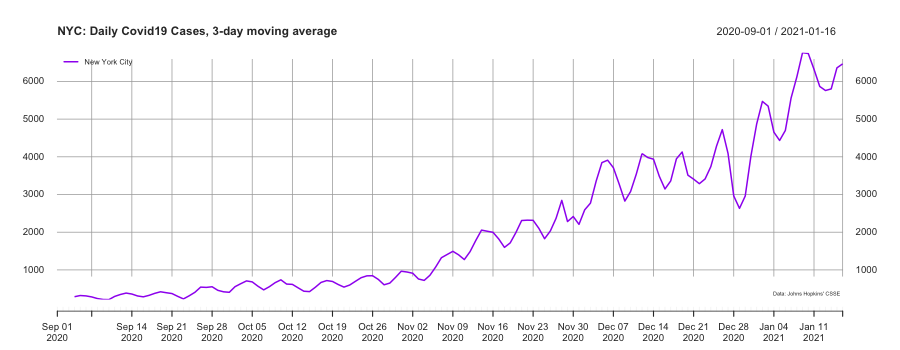
The next one is a 3-day moving average of daily case counts across the city.
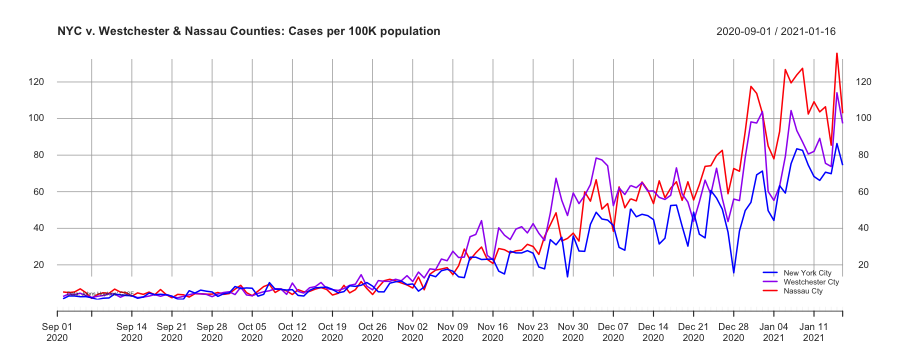
The next graph plots new daily cases for New York City and adjacent counties of Nassau and Westchester.
