Daily growth rate of Covid-19: US & NY state

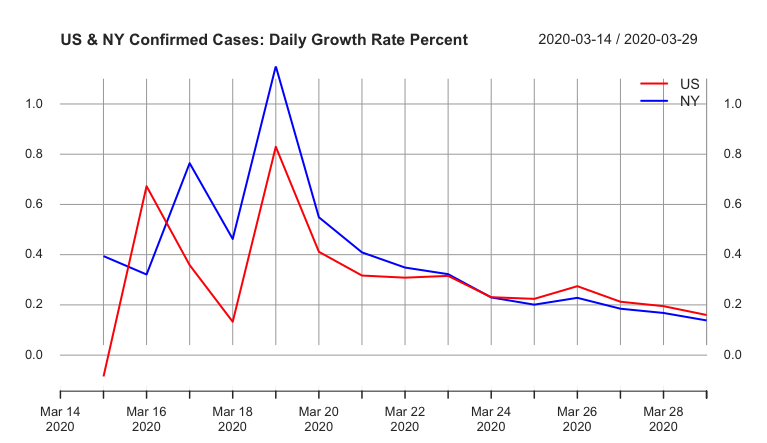
This is a graph of the percentage change in positive tests for Covid-19 from day to day for the US and New York state. The initial spikes in the growth rate reflect the aggressive testing posture of New York City and New York state. Though declining, the rates need to go to zero and under for a while before we start to breathe easy. A leveling off of the lines, moving sideways, is no good because the absolute numbers are still growing. Recall your high school intro to compound interest and the perils of credit card debt. Something growing at a steady 10% rate, compounded daily, is still growing by 10% on a higher “balance” each day.
The lines for the US and NY are synced, also reflecting the aggressive posture of NY & NYC. At some point, as governors start testing instead of recklessly shirking their duties and grandstanding, the numbers in other states will start to rise and the US and NY lines will likely diverge. I will be posting a daily update of this graph each morning, and adding others; first of which will be the US minus NY state. Stay tuned.
Raw data from the Github page of The Center for Systems Science and Engineering (CSSE) at Johns Hopkins University. Confirmed case numbers from before March 14 have been left out for two reasons. One, till about March 8, they are small numbers that jump around, skewing the scale. And there is very little data for March 13 for all but 2 or 3 states, which also skews the scale. Look for my code on Github by the end of the day.


