Sharp drop in complaints to NYC 311 last quarter.
What’s behind the drop in Q3, 2019 complaints to 311?
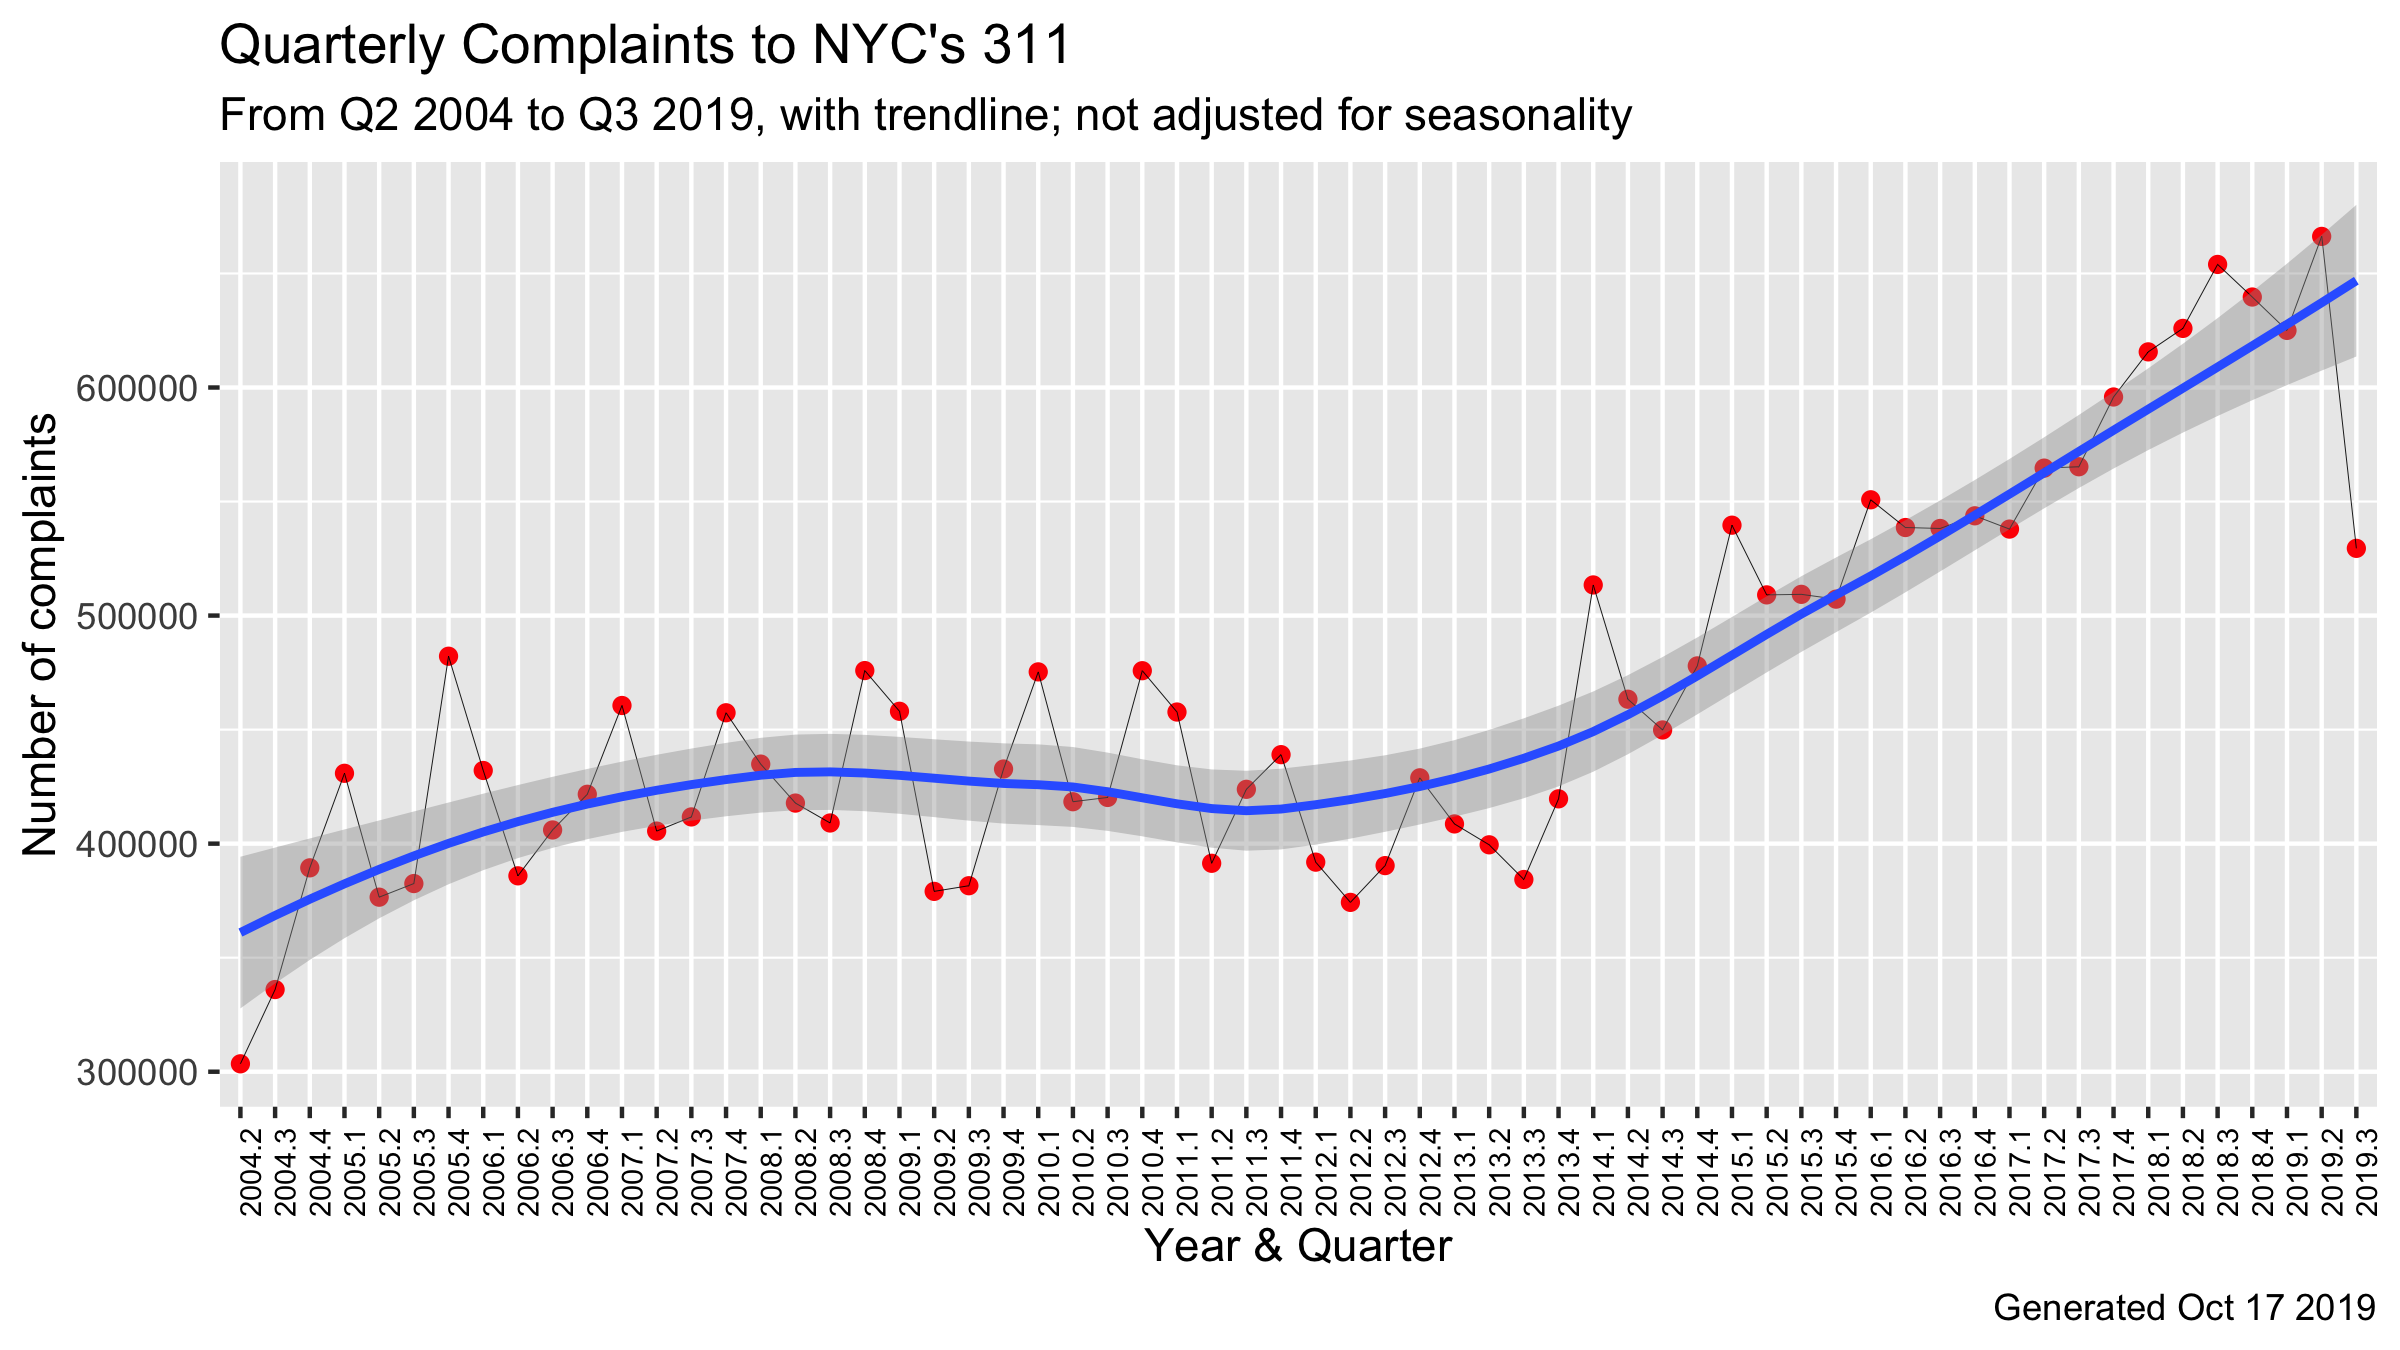
The graph below plots the total number of complaints to 311. As noted here, complaints to 311 are highly seasonal, and the data can be expected to vary from quarter to quarter; as evidenced by the graph itself. However, the drop from Q2 to Q3 of 2019 appears rather larger than usual and merits a closer look.

There were 666,257 complaints in the second quarter of 2019 and 529,479* complaints in the third quarter, a drop of 136,778, or 21%, from the second to the third quarter. This is what was eye-catching in the graph above.
As noted before, some 311 complaints vary a lot seasonally. In order to compare like with like, we go back a year and compare the third quarter of 2019, when there were 529,479* complaints, with the same quarter last year, which had 653,968 complaints. In all, there were 124,489, or 19%, fewer complaints in Q3 of 2019 compared to Q3 2018. Next, let’s see how that nearly 20% drop is spread across the agencies handling complaints coming in at 311.
    Agency  y2018  y2019 Change Percent
1     DSNY 117846  29053 -88793  -75.35
2      HPD 112332  44371 -67961   -60.5
3      DEP  54945  50058  -4887   -8.89
4      DOF   4556      0  -4556    -100
...   <NA>    ...    ...    ...     ...
14     DPR  33501  35527   2026    6.05
15     TLC   7073  10719   3646   51.55
16     DOT  56802  62728   5926   10.43
17    NYPD 207592 238881  31289   15.07
The list above is ranked by the change in the actual number of complaints recorded, not the percentage changes. As you can see, NYPD had, in percentage terms, an unremarkable increase of 15% which is far lower than the Taxi & Limousine Commission’s increase of 52%. But the actual NYPD numbers are nearly 10 times those of the TLC. Eight agencies saw a total increase in complaints of 44,265, while nine agencies saw a combined drop in complaints of 168,754, for a net drop of 124,489. The drop in numbers for the departments of Sanitation, and Housing Preservation & Development, are particularly noteworthy. We’re going to look at the four agencies with the most drops a little closer and see if we can figure out the how and why of the 20% drop overall. Specifically, let’s look at the types of complaints that saw the largest drops in each of the four agencies.
Department of Sanitation (DSNY):
                        Complaint.Type  2018 2019 Change Percent
1: Request Large Bulky Item Collection 52081    0 -52081    -100
2:                Sanitation Condition 13673  761 -12912     -94
3:                            Graffiti  7511    0  -7511    -100
Department of Housing Preservation & Development (HPD):
         Complaint.Type  2018  2019 Change Percent
1: Unsanitary Condition 26470 11503 -14967     -57
2:        Paint/plaster 15760  3266 -12494     -79
3:             Plumbing 12519  4984  -7535     -60
Department of Environmental Protection (DEP):
   Complaint.Type  2018  2019 Change Percent
1:          Sewer 10284  8500  -1784   -17.3
2:           Lead  3039  1728  -1311   -43.1
3:          Noise 13069 11829  -1240    -9.5
And, last but not least curiously, the department of Finance (DOF) seemed to have gotten no complaints at all in the last quarter. So let’s see what the DOF complaints were about in the third quarter of 2018:
   Agency year               Complaint.Type    N
1:    DOF 2018 Dof Property - Payment Issue 4263
2:    DOF 2018                         Drie  284
3:    DOF 2018              Advocate - Lien    4
We have one more aggregation to consider. This forensic examination was prompted by the sharp drop seen when visualizing (the boomer word is ‘charting/graphing’?) quarterly 311 complaints by council district. Was the ~20% city-wide drop also more or less uniform across council districts? The table below shows that there is no outsize drop in any one single district:
    Council_District y2018 y2019 Change Percent
1                 10 35948 30641  -5307  -14.76
2                 39 29952 24775  -5177  -17.28
3                 19 26888 22345  -4543   -16.9
4                 51 24582 20276  -4306  -17.52
5                 43 28736 24510  -4226  -14.71
6                 50 25269 21584  -3685  -14.58
...              ...   ...   ...    ...     ...
48                 4 21162 21731    569    2.69
49                 2 24286 25114    828    3.41
50                33 28626 29886   1260     4.4
51                34 33950 36980   3030    8.92
So, have New Yorkers stopped throwing out large, bulky items? Graffiti no longer a New York thing? And not a single person had a question or complaint about their city/property taxes in the last quarter? A very sharp drop in a single agency may raise questions such as: did they stop taking complaints about some issue? (311 stopped taking complaints about excessive noise from pressure/power washers about 1.5-2 year ago.) Did the laws/regulations change and “solve” a whole class of complaints overnight? And did all this happen at the stroke of midnight on the night of June 30th? When you see zeros where you expect positive numbers, across several agencies and across different types of complaints, the simpler explanation may be that some data reporting/archiving glitch occurred. This post will get updated on hearing back from the folks in charge of the city’s open-data warehouse.
* Approximately 20,000 complaints, that were missing the information to abstract the related council district number, are excluded from this analysis.
Update 12/15/2019: Zachary Feder, Open Data Program Manager in the Mayor’s Office of Data Analytics said via email that some scheduled changes to 311 data, and reporting, took place in the last quarter, during the course of which some other data “was also changed inadvertently” and expects it to be fixed soon.
311 data from NYC Open Data.


311 recently stopped taking sanitation complaints in the app and on the website. And I’ve found for my own complaints on those things, that it usually takes 15 min per complaint on the phone. I personally now file fewer complaints because of that.