Quarterly 311 Complaints: City Council District 25
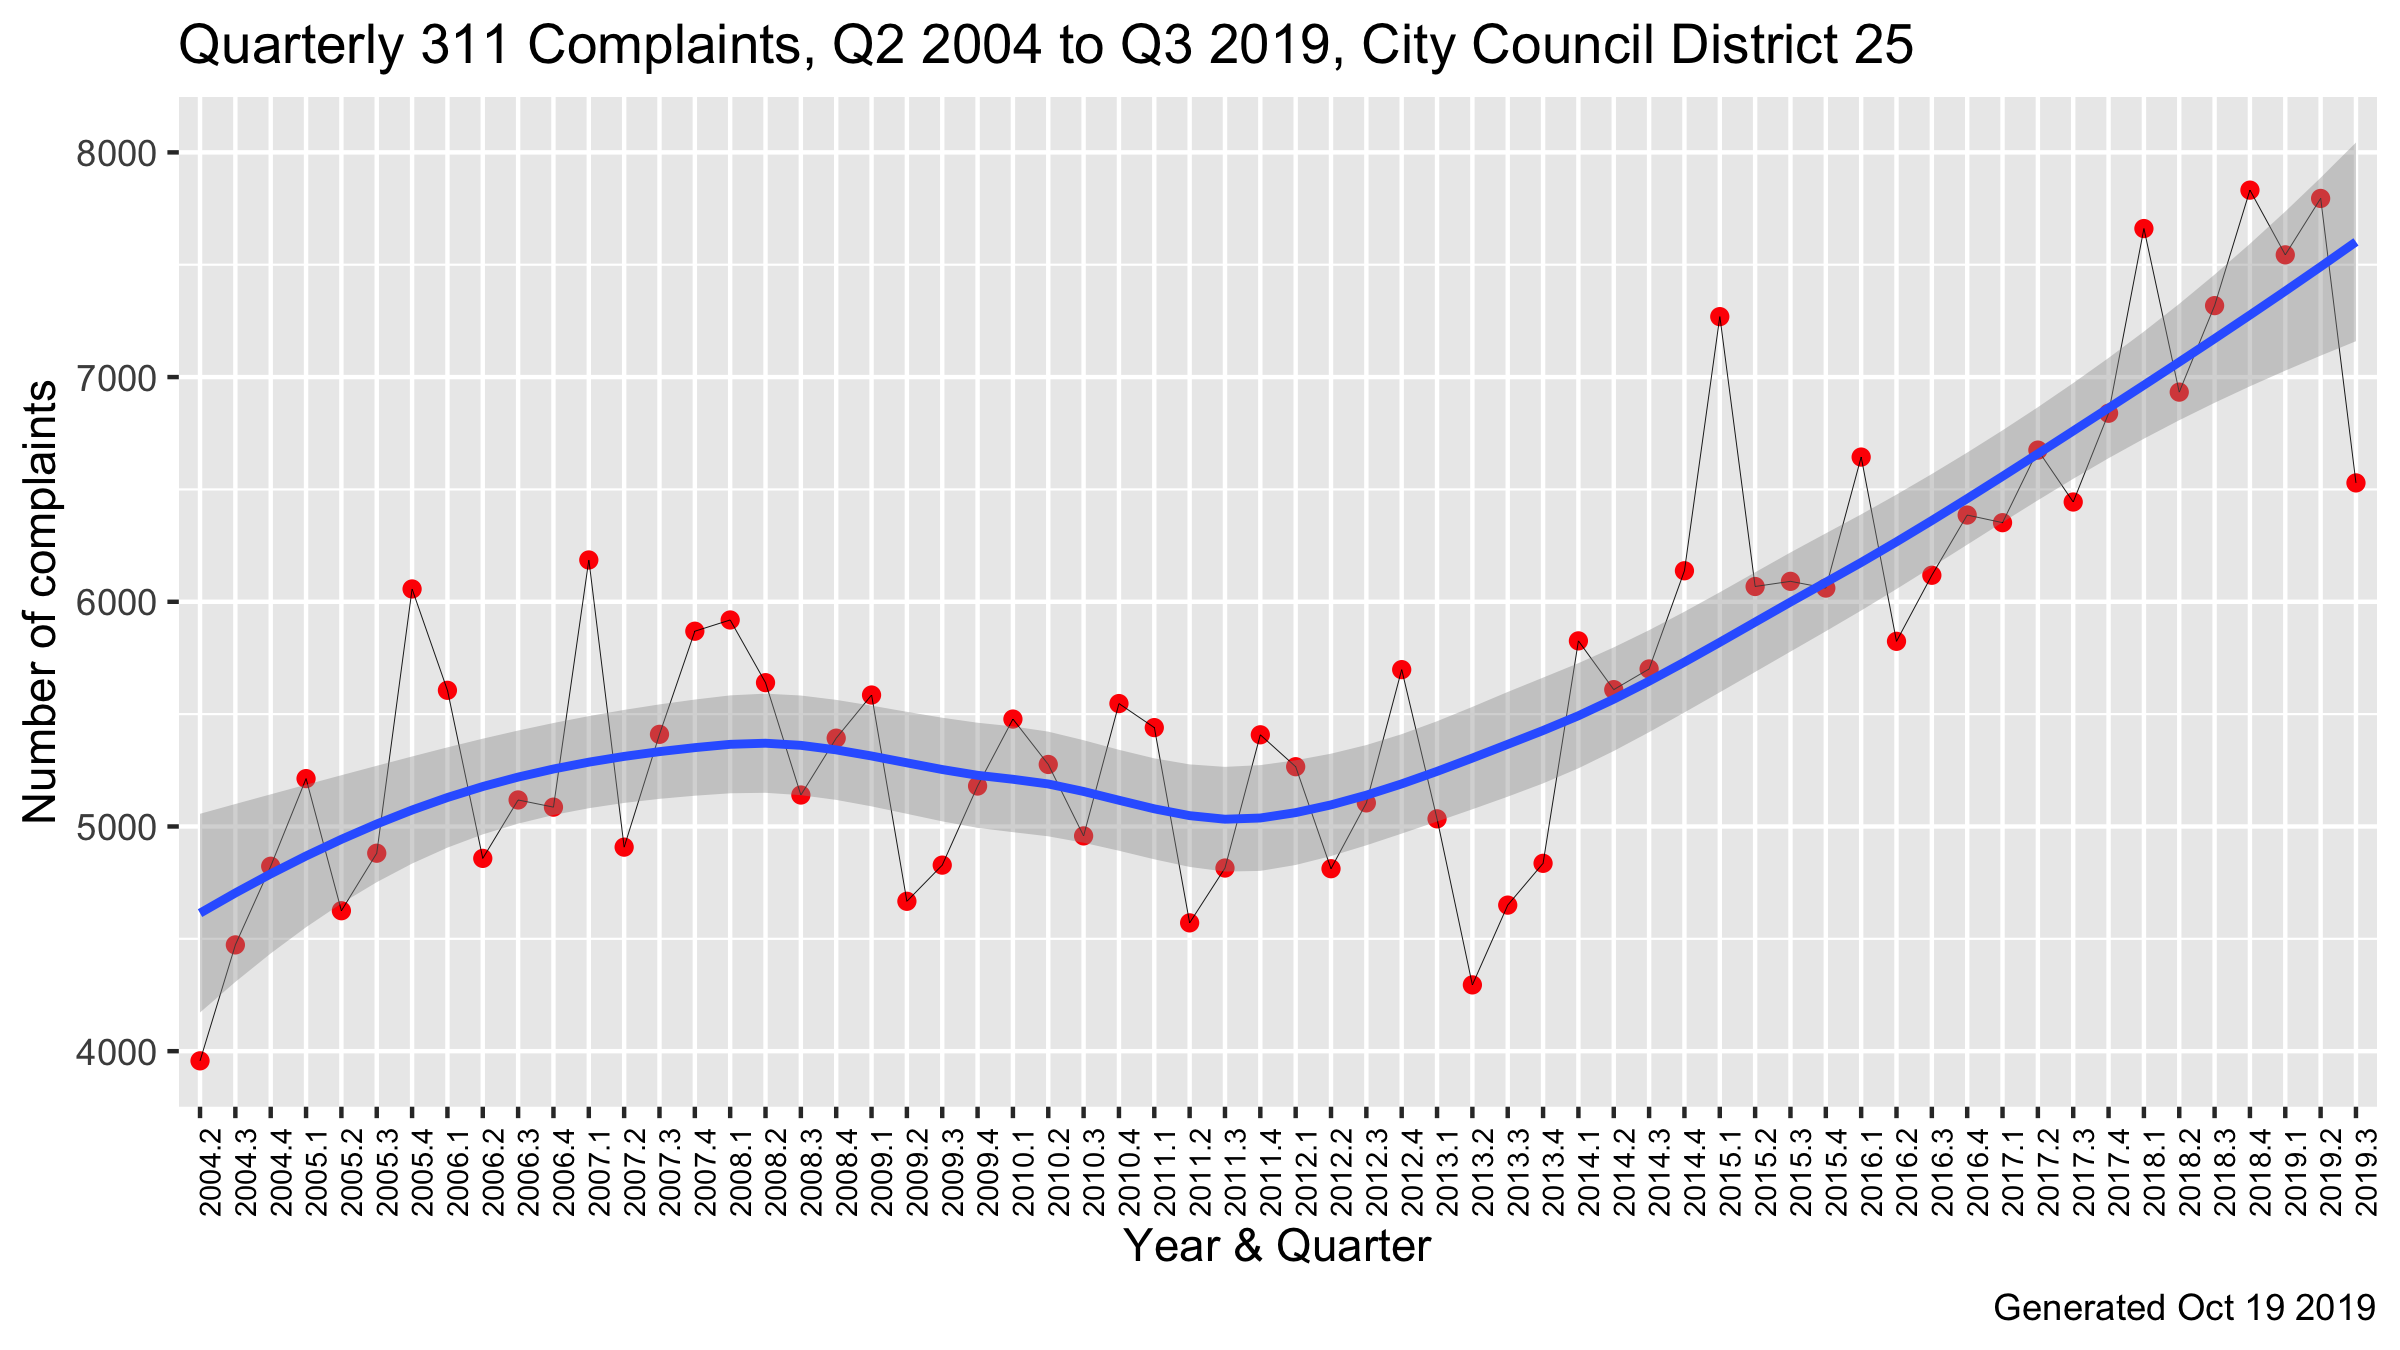
NYC 311 Quarterly Complaints: City Council District 25
Councilmember Daniel Dromm
First elected to the New York City Council in 2009. Representing the Queens neighborhoods of Elmhurst, Jackson Heights.

Reading the graph:
NB: The graph only charts the number of complaints received at 311, not how or if they were addressed.
Each dot marks the total number of service requests (scale on the left) received at 311 for a given year and quarter. The line connecting the dots is just a line connecting the dots; it helps the eye follow the plot.
The blue line is the trend line, the regression line. This is useful in getting a sense for whether the trend is up or down at a particular point in time; especially when the data points are not marching along like well-behaved ants, but all over the place like tourists. The gray band is the ‘range’ in which you would expect or predict the next set of numbers to fall in, but, as you can see, the actual complaint numbers are erratic and overshoot wildly.
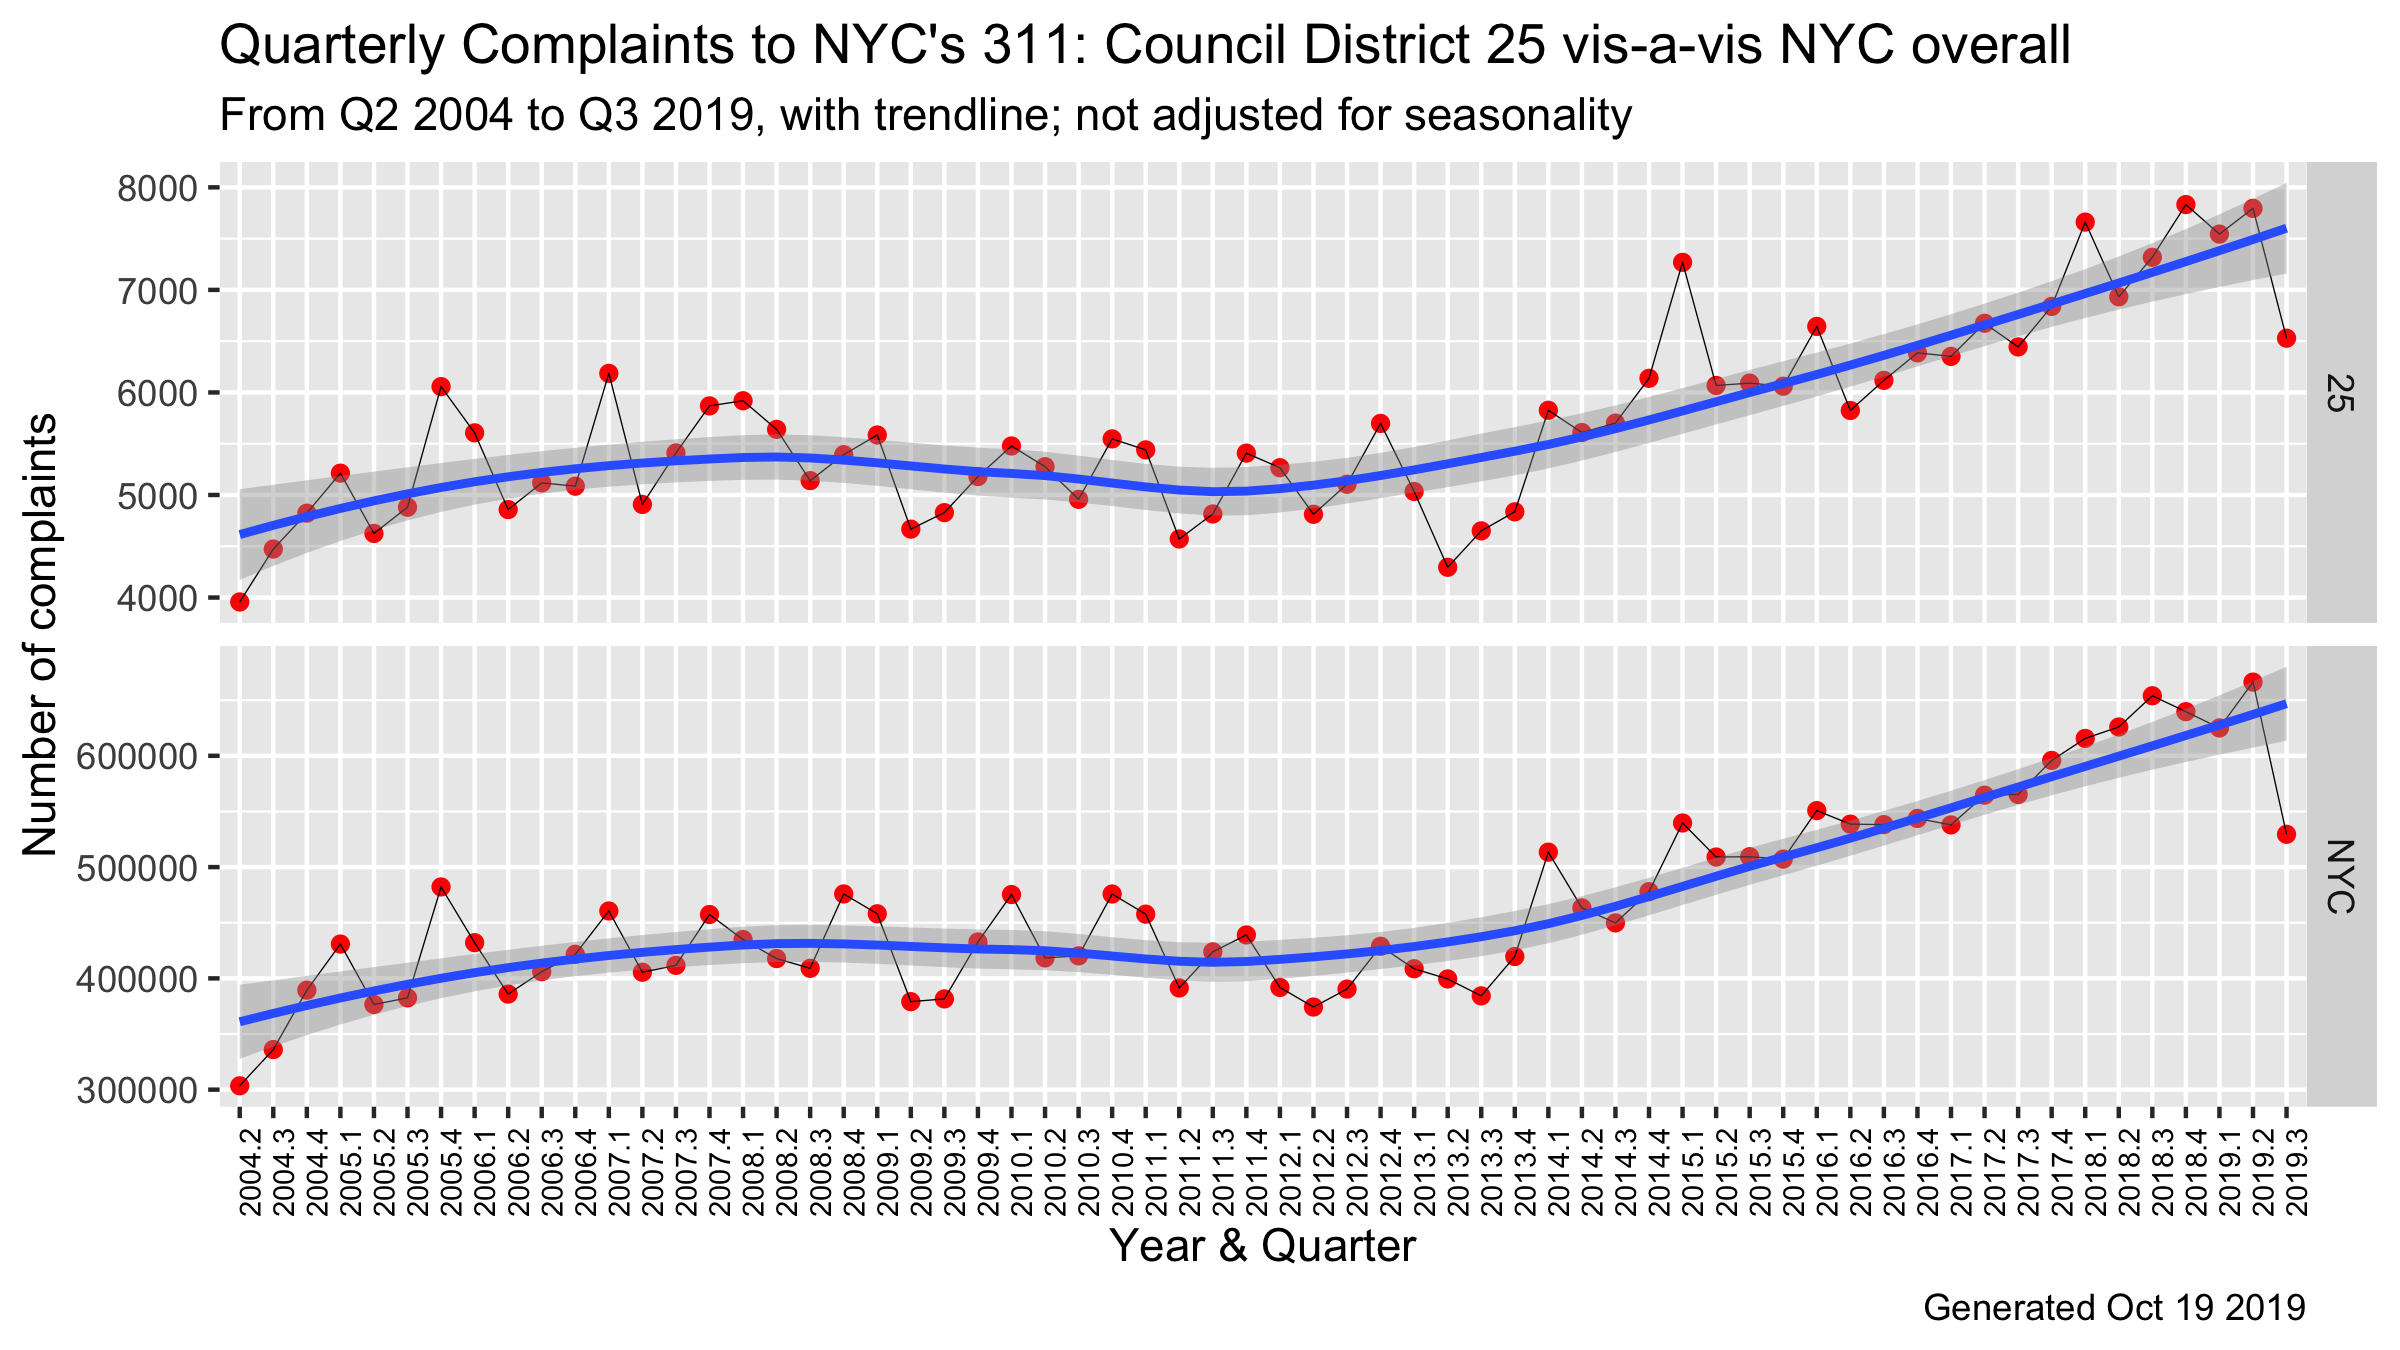
Below is a two-fer: the top graph is for Council District 25 and directly below it is the graph for NYC overall. In general, the trend in a district is expected to broadly follow that of the city, even if the district numbers don’t follow every twist and turn in city numbers. This type of pattern comparison can help in spotting anomalies. If your district’s numbers are noticeably down when the city is up, or vice versa, digging a little deeper may explain why.

Seasonality:
None of the data used here has been adjusted for seasonality. Meaning what exactly? Some types of complaints are season-dependent: such as complaints about snow removal or noise from ice-cream trucks. Some types of complaints may be year-round issues, but have a seasonal component. For example, complaints about noise from honking may drop in winter due to people keeping windows shut, while complaints about hot water may be frequent in winter but slow to a trickle in the summer months. Puns are a year-round hazard, no seasonality.
311 data from NYC Open Data.

