How well do city agencies address New Yorkers’ complaints?
If you’re a New Yorker, chances are high you got past the stage of cussing, under your breath or not, about some aspect of city life and picked up the phone to officially record with city hall your own “I’m mad as hell and I’m not taking it anymore” moment. And then what happened? Only you know. The world sort of knows too, but it’s buried in a mountain of data.
 |
| One of them performed better than the others. Way better. |
You can dig around in the data and ask, from the point of view of an average New Yorker: how did the city solve a particular customer’s problem? And the natural next step after that is to ask: how effective is a city agency at solving similar problems reported by other people? It amounts to a data-driven performance review, if you will. After some digging around I was surprised at which of these six agencies ranked highest in effectiveness, and how well it was doing relative to the city as a whole.
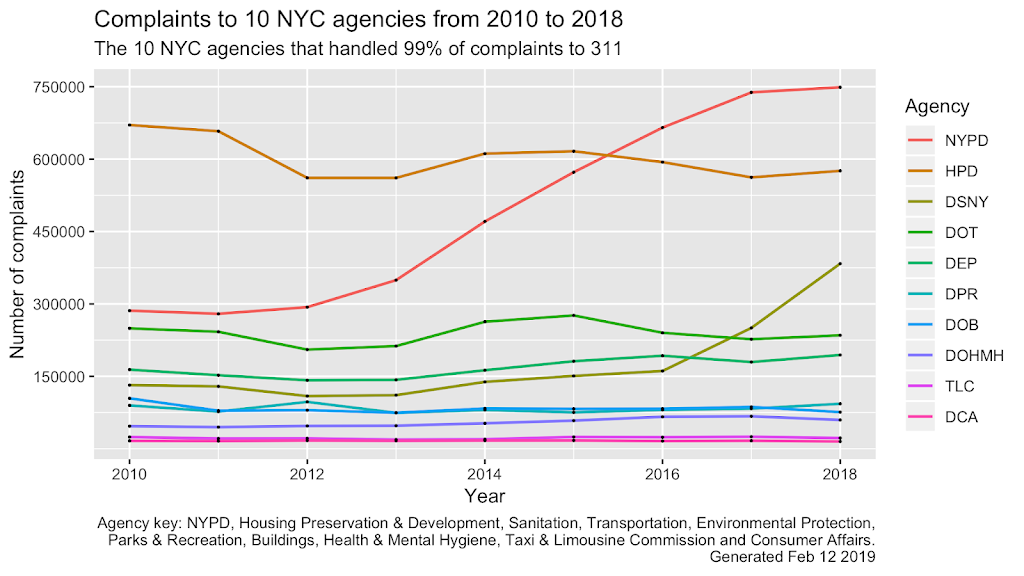
Under analysis are just over 17.5 million service requests (let’s call them complaints) to NYC’s 311 call center from 2010 to 2018. Broken down by the agencies that handled them. Ten agencies handled more than 99% of all complaints:

That graph plots only the number of complaints, not how those complaints were resolved. Looking at complaints alone, over the years it seems a larger and larger share of incoming complaints are being addressed or assigned to NYPD (these numbers do not include calls to 911). Also notable is HPD’s reduced/stable share of complaints; while the department of Sanitation sees a sharp spike in complaints starting 2016.
The years from 2010 to 2014 were under Mayor Bloomberg and 2015 to 2018 were under Mayor Bill de Blasio. The rise in NYPD numbers seems have started under Mayor Bloomberg and continued under his successor. The DSNY spike from 2016 is clearly on Mayor de Blasio’s watch, and is a departure from trend or a new trend being established.
One of the things that we do is to assign all data to city council districts. Based on the premise that the average New Yorker has no oversight over city agencies, and agencies are not directly accountable to the public they serve. They are accountable to the mayor and to city council members. If you’re not getting solutions from a city agency, your next best recourse is your elected representative. Community Boards would be an avenue for redress, in theory; but they have no legally enshrined oversight powers so it’s a moot point what measurable impact boards have on quality of life.
A break-down of resolutions / performance by council district is coming, but let’s look at agencies first to get an overall view of agency effectiveness. How were all these complaints addressed by the agencies? We organized the answer around a simple test: from the point of view of an average New Yorker, was the problem solved?
Each agency reports the action it took on a complaint. If the report said: we took action to fix it, we fixed it, we issued a violation, we were all over them like white on rice – chalk one up for the average New Yorker – their problem was resolved. Agencies don’t say ‘like white on rice’ but it represents the level of unambiguity we look for. If an agency says keeping bees in NYC is not illegal (they did) – we do count that as fixed. Maybe not the response you expected but if it’s not illegal, it’s not illegal.
On the other hand, if an agency says the equivalent of we are looking into this problem, check back later – we do not count that as fixed. If they say something is the job of another city agency – we do not count that as fixed. If a reported condition was “not found” (lots of them), it wasn’t fixed. By definition. If an agency cannot find a rat or jackhammer drilling or a raucous drunk: how can they solve the problem? A legitimate and fair question. Maniacs who sit on their horn, drunks doing their “loud talking” – they’re usually gone mere minutes later. But from the POV of the person reporting the issue, however, was their problem solved? The answer is no.
When something is ‘not found’ or ‘not observed at the time of inspection’ tens of thousands of times every year, it is up to the city and its agencies to figure out how to design a better mousetrap so that it catches more mice. (No, PETA, we are not changing our metaphors!) Real money is being spent taking those calls, assigning them to agencies, which assign them to individual employees, some percentage of whom go out to inspect or look for the reported condition, and they don’t find it. A tremendous amount of activity producing exactly zero results.
It falls to the agency commissioners to figure out how to enforce in ways that reduce overall incidence. If DOB denies automatic approval of job filings to contractors/entities who get written up for, say, jackhammering without proper noise abatement in place, would that lead to better overall compliance? Would there be less nuisance honking if the NYPD commissioner decreed roving ‘honking traps’ to ticket morons who seem to think honking will clear the traffic jam ahead of them? The answer would seem to be yes, and yes; but the point is, it is for the agency heads to figure out how to enforce more smartly, to get results.
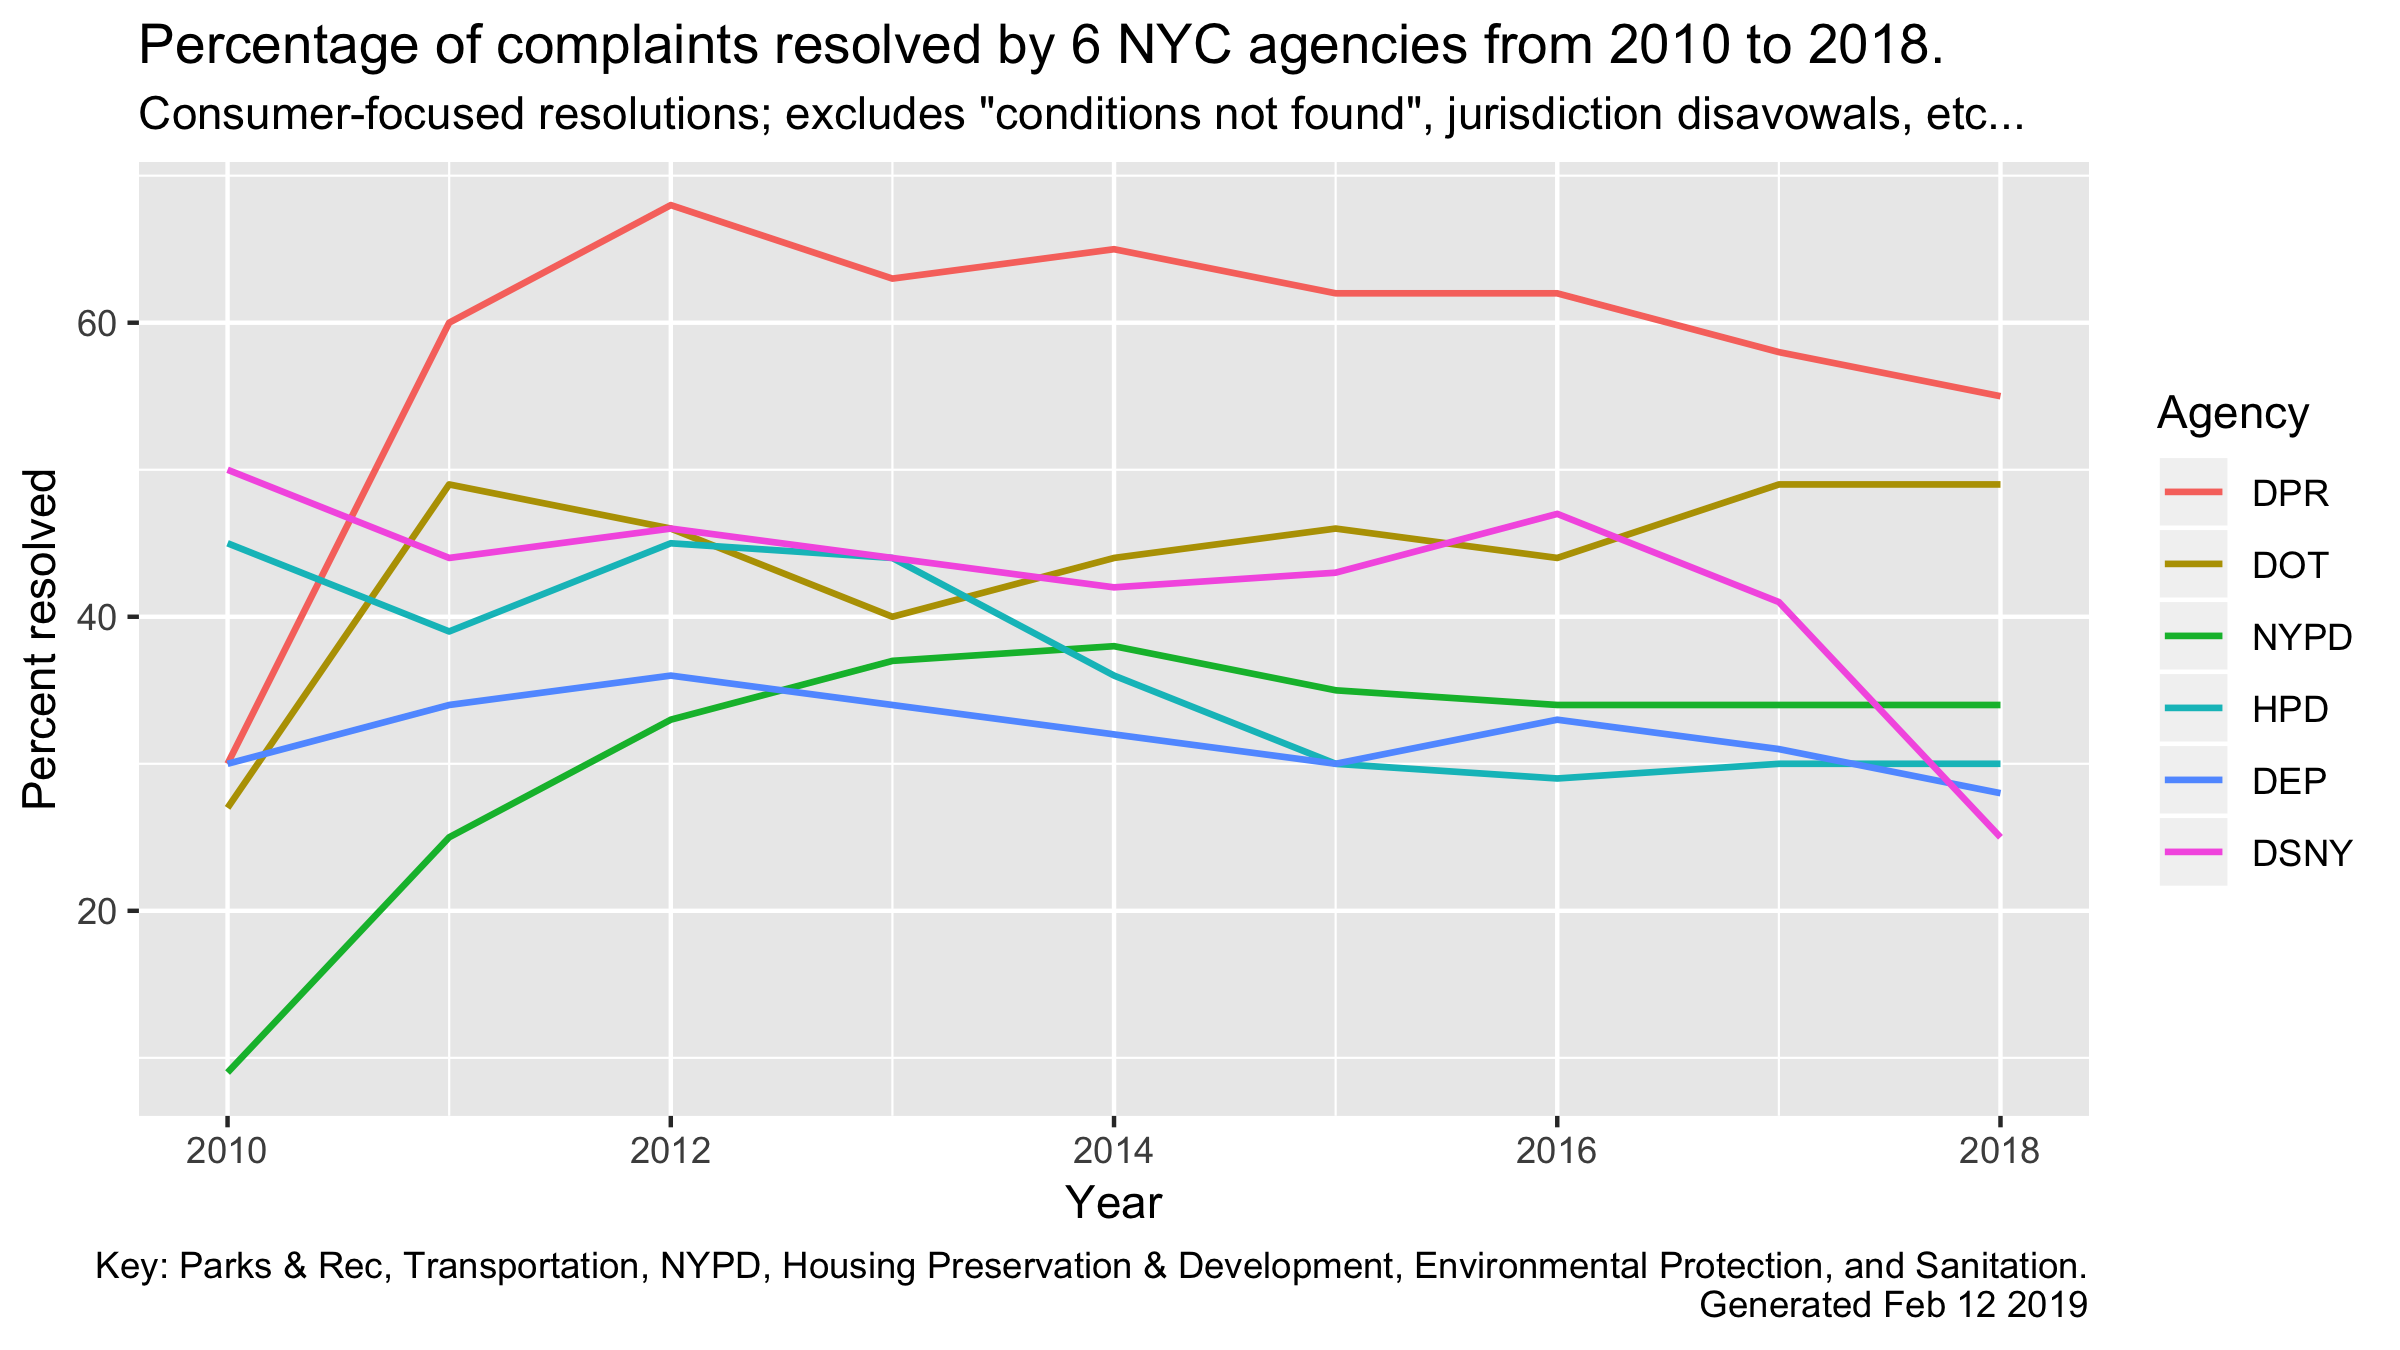
Here’s the graphic, top six agencies ranked by resolution rates in 2018. Agencies listed in the legend to the right:

Jurisdiction disavowals? Just invented some PhD. talk for passing the buck – “not my job”, “check over there” etc.
In the “Yes, we fixed that!” rankings, Parks and Rec is the only agency clocking in at better than 50% over the last seven years. NYPD improved its performance from 2010, peaked in 2014, but held on to most of the performance gains since then. HPD has been slipping, even though the level of complaints (from the previous graphic) is more or less steady. Unlike DSNY (Sanitation), which saw it’s resolution rate decline while its incoming complaint numbers have been rising. Looking at what kinds of issues are getting fixed and what are not getting fixed, could be informative. DPR and DSNY get added to the to-do list for a deep dive.
Raw data from NYC Open Data

