Domestic Violence in NYC, 2017
Domestic Violence in NYC, 2017
December 10, 2018
The Mayor’s Office to Combat Domestic Violence (OCDV) released summary data pertaining to domestic violence incidents in the five boroughs occuring in 2017.
The data consists of two types of domestic violence incident reports, or DIRs, which NYPD officers are required to file if they believe an incident they are responding to involves domestic violence. One type of DIR relates to incidents involving intimate partner violence, abbreviated as IPV DIRs. The other category relates to violence between non-intimate family members; family by marriage or by blood. They are abbreviated as FAM DIRs.
The data is organized by community board districts and includes incidents in “Joint Areas of Interest”“, which are areas that overlap two districts, such as a park. There were 114 IPV DIRs (of a total 108,821) that occured in these joint areas of interest. There were 34 FAM DIRs occuring in Joint Areas of Interest out of a total 81,554. Both are omitted in the analysis which follows which is solely by community board districts .
Overview
The table below presents summary statistics for IPV and FAM DIRs and adds a total for both combined as “All_DIRs.”
         Min. 1st Qu. Median Mean 3rd Qu. Max.
IPV_DIRs  470    1172   1596 1842    2594 4317
FAM_DIRs  121     769   1162 1382    1940 3453
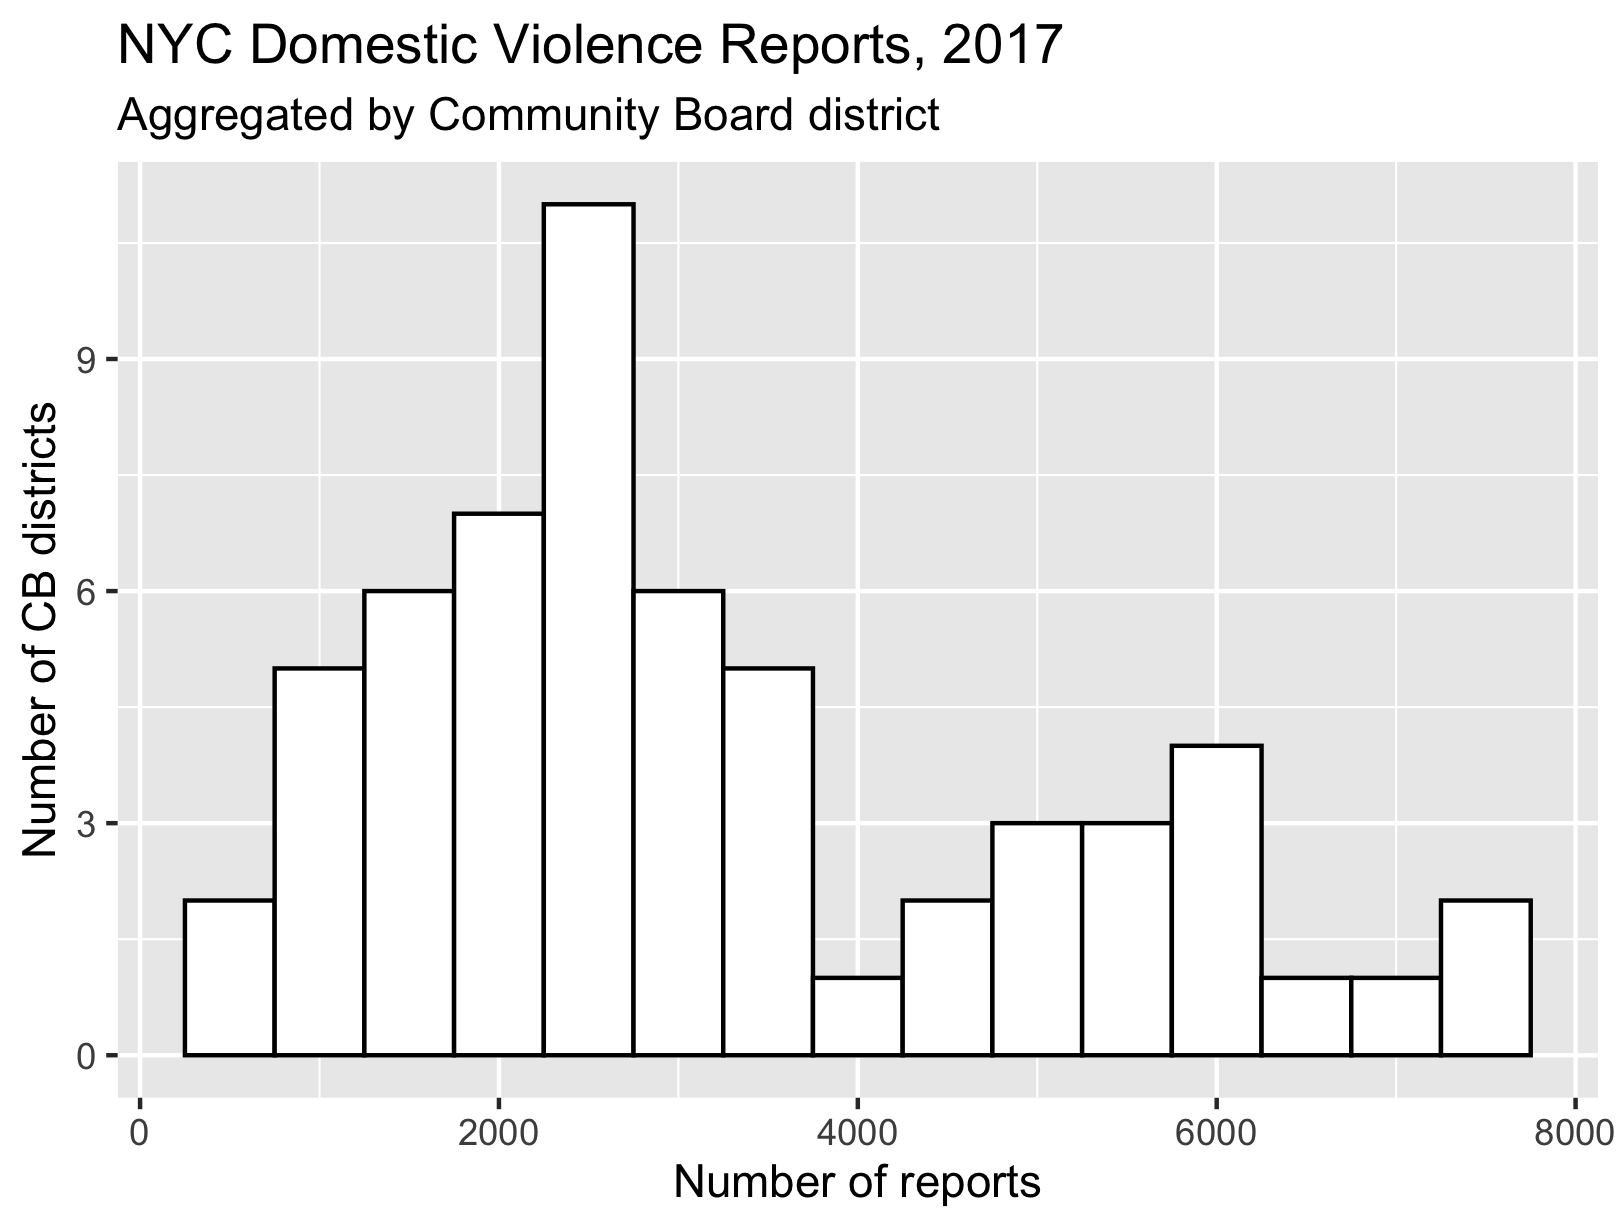
All_DIRs  598    1980   2707 3224    4694 7679
The rest of this post explains what those ‘summary statistics’ above represent; readers with a knowledge of statistical basics can pick up from part 2 later this week.
What do these numbers mean? Let’s take the first row of numbers – IPV DIRs. As mentioned before, domestic violence reports are grouped by community board district. “Summary statistics” is where data about something (community boards and domestic violence in this case) are grouped and ranked in order. There are 59 community boards across New York and the community board with the least number of Intimate Partner Violence reports had 470 of them, that is the number under “Min.” The lowest number of reports for domestic violence involving (non-intimate) family members is 121. Finally, the community board that had the lowest number for both categories of domestic violence combined was 598. [Note that these numbers don’t add up. That is because, for example, Manhattan CB2 had 470 IPV reports and 121 FAM reports, while Manhattan CB1 had 496 IPV incidents and 121 FAM incidents. When you add up IPV and FAM incidents, Manhattan CB2 turns out to have the lowest overall number. It helps to think of “All DIRs” as a category by itself, which we created to get an overview of all domestic violence.]
“1st Qu.” and “3rd Qu.” are ‘quantiles’ – where you group them so that each quantile, or bucket, contains an equal number of the total. In this case, the 59 community boards are divided into 4 quantiles, so each bucket contains a quarter or 25% of the community boards. What does 1172 for the 1st quantile of IPV DIRs mean? It means, out of the community boards ranked from least to most IPVs, the first 25% of community boards thus ranked had 1172 or fewer incidents of intimate partner violence reports. 25% of 59 community boards is 14.75 so the community board ranking 15th had 1172 IPV reports and all boards to the left had less than that number, with the first community board having 470 reports (the minimum/Min.).
Next is the “Median” – it is what divides the thing being counted into two equal halves. Half of all community boards had less than 1596 IPV reports and half had more. When the number of quantiles is 4 the median is also the cutoff for the second quantile or bucket. The first quantile/quarter had 1172 or fewer IPV reports, and the second quantile has from 1172 to 1596 IPV reports. The 3rd quantile of community boards had from 1596 to 2594 IPV reports. And the fourth quantile had between 2594 and 4317 (the “Max.”) IPV reports.
We left out “Mean” at 1842, which is the average number of IPV reports per community board. The mean, unlike the median and quantiles, is not a measure of position which tells you where in the ordered ranking you are and what the value at that position is.
The juxtaposition of median and mean, however, can give valuable information. Lookng at all DIRs, we see that the mean of 3224 domestic violence reports is consideraby higher than the median of 2707. In practical terms this means there are many community boards with relatively higher rates of DV, or reports of DV to be more accurate since we only know of instances that wound up in front of NYPD. Or, there are a few community board districts with very high incidences pulling the average well above the median.
As you can see, the least number of All DIRs (IPV and FAM reports combined) filed by NYPD for a community board was 598. The community board with the most reports filed had 13 times more at 7679. Intuitively, you expect differences in rates of most things to vary due to socio-economic factors, but unusually large differences stand out. And there could be as many explanations as there are people trying to understand and analyze this disparity in reports of domestic violence.
In part 2, I will look at the three community boards (and the neighborhoods they comprise) with the most and least reports of domestic violence and see if that sheds any more light on this seeming disparity.


