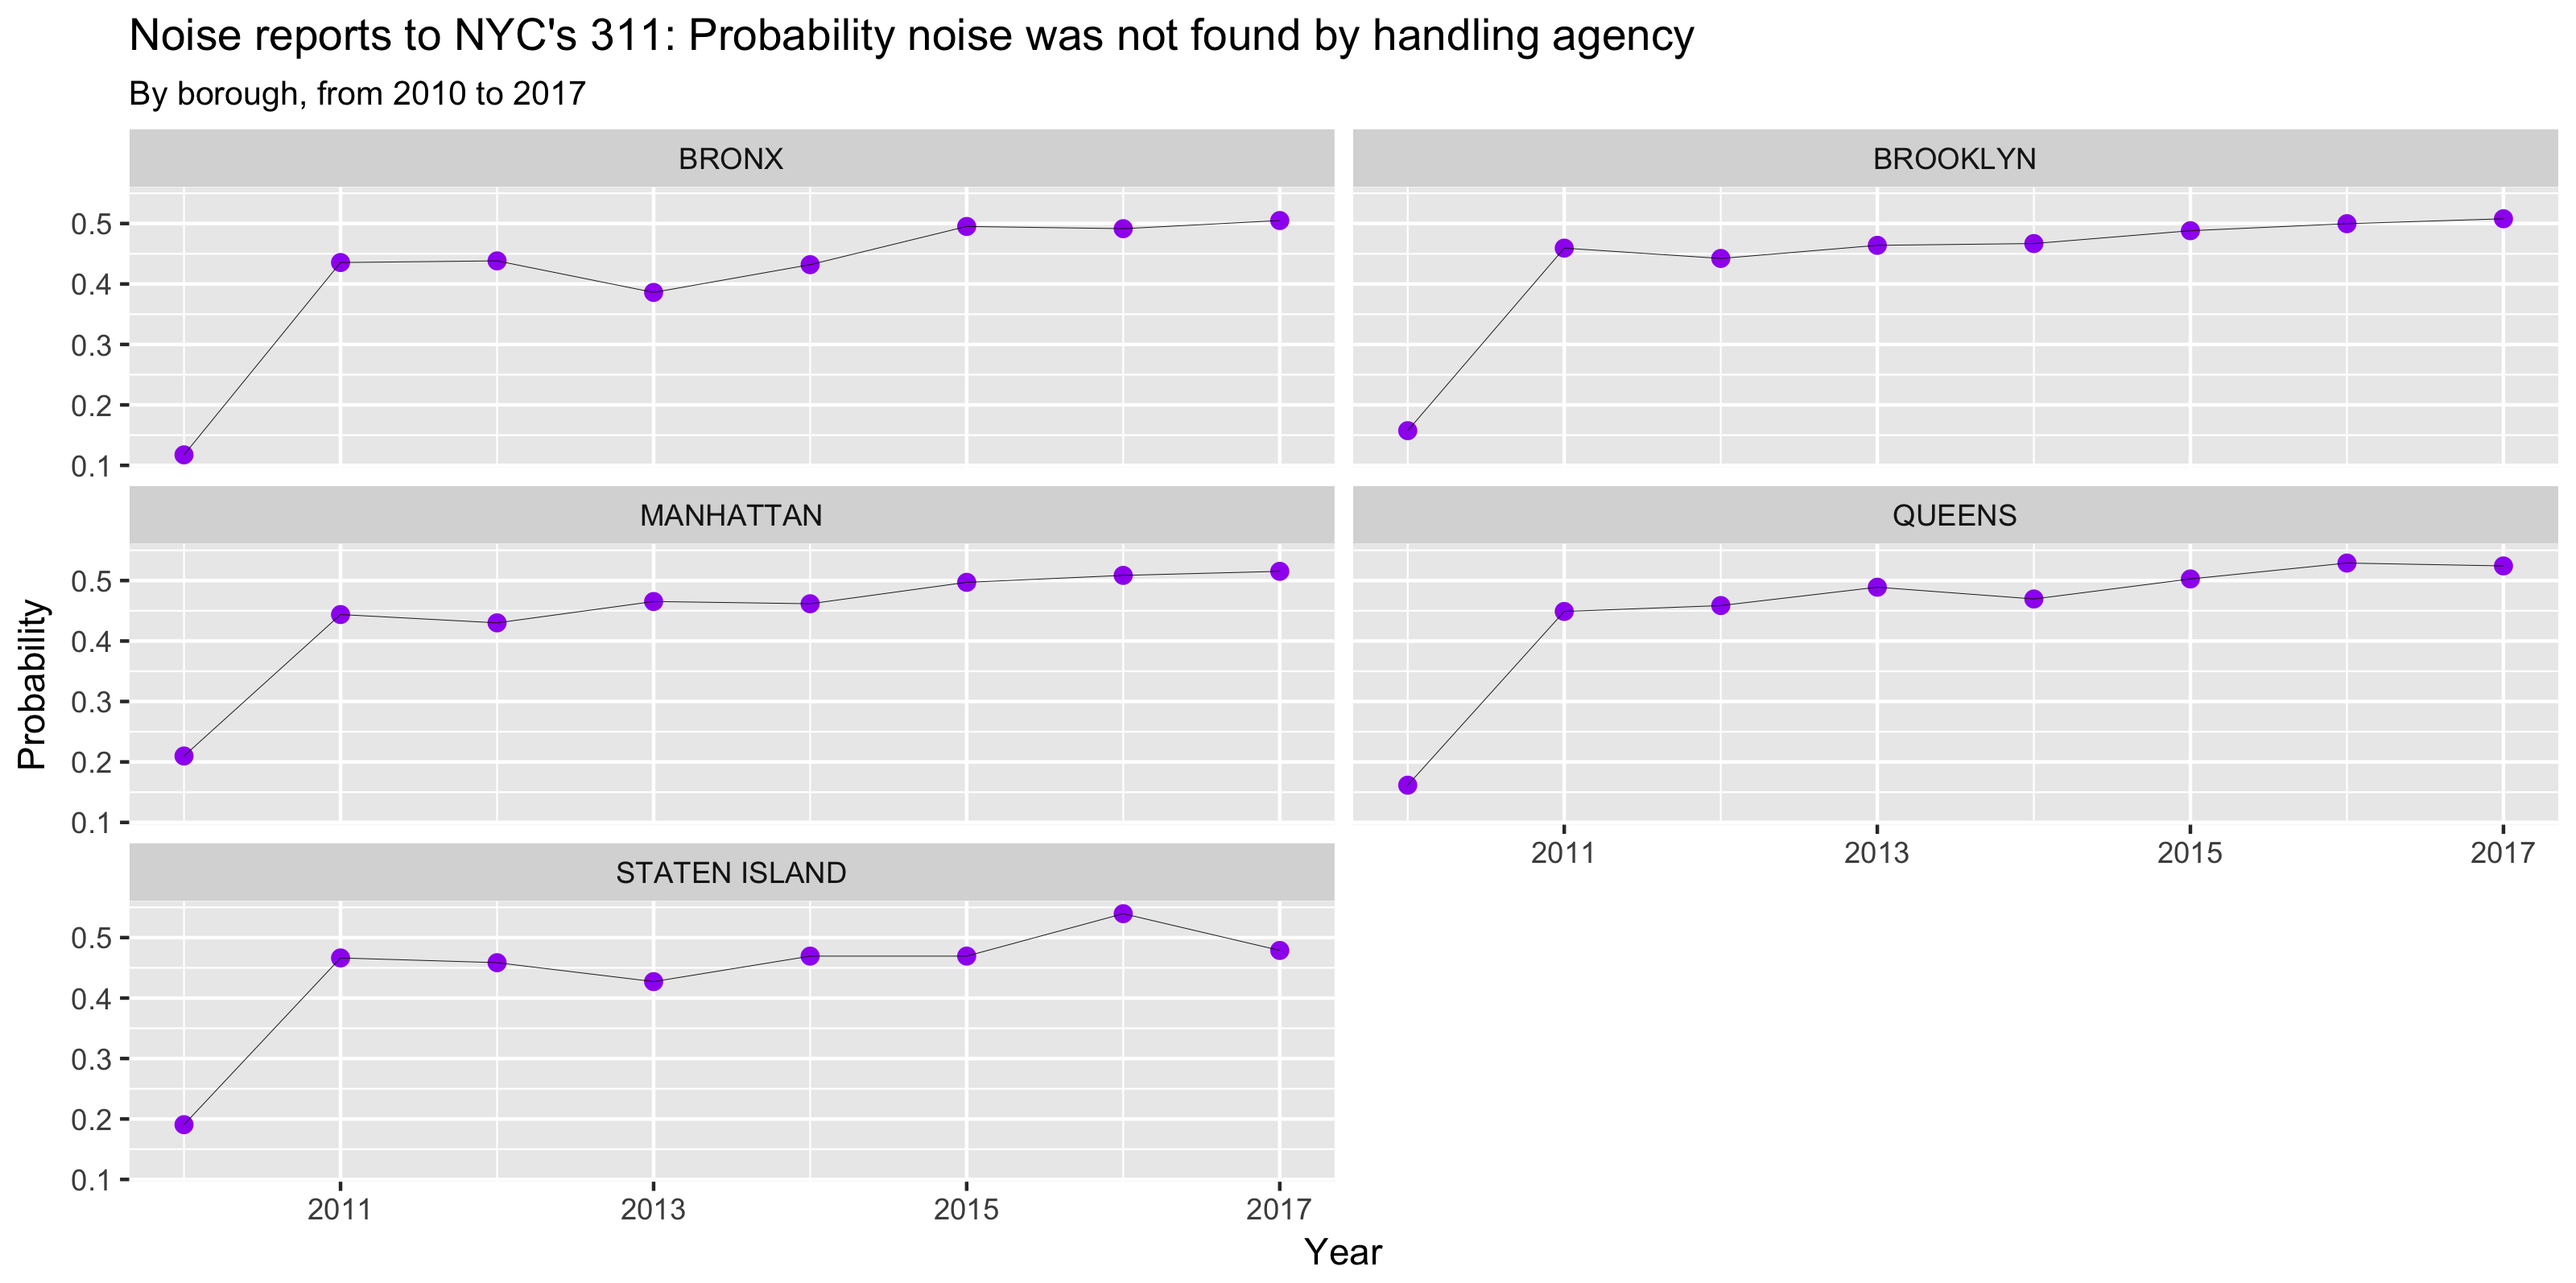
NYC Noise: 2010 – 2017: probability your noise was not found, by borough
Number of service requests to NYC’s 311 from 2004 to 2017: 26.99 million

In my last post, I looked at the probability of “Noise? What noise?” This is when a New Yorker picked up the phone (or used their app) to file a complaint about noise, and a city agency was unable to track down that noise to do something about it. Obviously, if NYPD or the Dept. of Environmental Protection cannot find the noise, not much they can do to fix it. It turned out that 51% of the time the noise was not found, city-wide. I decided to dig deeper and see if there was a difference in the number across boroughs. As it turns out, the “Noise? What noise?” rate got worse by a percentage point, from 2016 to 2017, in the Bronx, Brooklyn, and Manhattan; declined a percent in Queens, and declined a noticeable 6% in Staten Island. I think I may look at what’s behind that 6% drop in Staten Island. Or the question – is there a specific type of noise that has, say, a 75% or higher probability of winding up “not found”?
| Borough | 2010 | 2011 | 2012 | 2013 | 2014 | 2015 | 2016 | 2017 |
| BRONX | 0.12 | 0.44 | 0.44 | 0.39 | 0.43 | 0.50 | 0.49 | 0.50 |
| BROOKLYN | 0.16 | 0.46 | 0.44 | 0.46 | 0.47 | 0.49 | 0.50 | 0.51 |
| MANHATTAN | 0.21 | 0.44 | 0.43 | 0.47 | 0.46 | 0.50 | 0.51 | 0.52 |
| QUEENS | 0.16 | 0.45 | 0.46 | 0.49 | 0.47 | 0.50 | 0.53 | 0.52 |
| STATEN ISLAND | 0.19 | 0.47 | 0.46 | 0.43 | 0.47 | 0.47 | 0.54 | 0.48 |
311 data from NYC Open Data downloaded at various times. As of Feb 5, 2018, 27 million rows, 52 variables till 2009, 53 variables from 2010. Parsed using R v3.4.3 in RStudio v1..1.423

