Slicing and dicing NYC Noise: 2004 to 2017, complaints aggregated by day and week
Number of service requests to NYC’s 311 from 2004 to 2017: 26.99 million
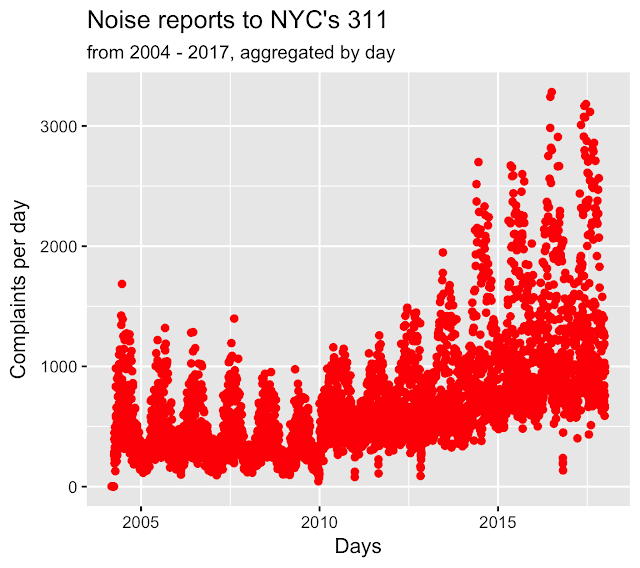
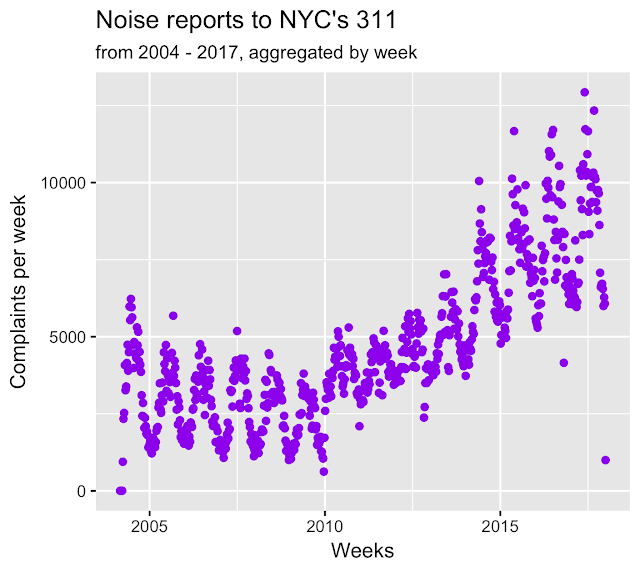
Two graphs of a total 3.3 million noise complaints to 311: the first one is a plot of the number of noise complaints filed per day from 2004 to 2017. The second is a similar aggregation but by number of complaints per week. Anything strike you as odd in either?


311 data from NYC Open Data downloaded at various times. As of Feb 5, 2018, 27 million rows, 52 variables till 2009, 53 variables from 2010. Parsed using R v3.4.3 in RStudio v1..1.423

