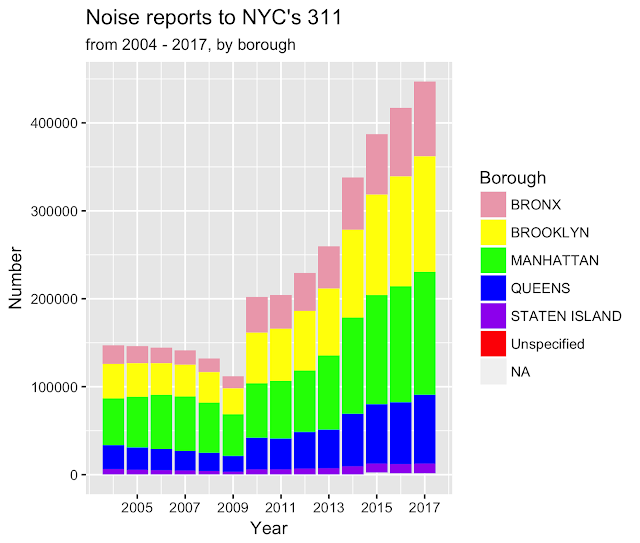
Slicing and dicing NYC Noise: 2004 – 2017, by borough, with table
Number of service requests to NYC’s 311 from 2004 to 2017: 26.99 million

| Year | Bronx | Brooklyn | Manhattan | Queens | Staten Island |
| 2004 | 21,071 | 39,230 | 53,208 | 27,312 | 6,243 |
| 2005 | 19,666 | 38,180 | 57,524 | 25,556 | 5,400 |
| 2006 | 17,755 | 36,016 | 61,533 | 24,317 | 4,985 |
| 2007 | 15,983 | 36,023 | 62,081 | 22,432 | 4,653 |
| 2008 | 15,192 | 34,870 | 57,200 | 20,569 | 4,112 |
| 2009 | 13,373 | 29,341 | 47,869 | 17,801 | 3,281 |
| 2010 | 40,437 | 57,356 | 62,259 | 36,073 | 5,840 |
| 2011 | 37,991 | 59,240 | 65,648 | 35,414 | 5,674 |
| 2012 | 42,977 | 67,812 | 70,181 | 41,507 | 6,829 |
| 2013 | 47,698 | 76,160 | 84,322 | 44,072 | 7,154 |
| 2014 | 59,375 | 99,947 | 109,449 | 59,969 | 9,136 |
| 2015 | 68,677 | 114,350 | 124,142 | 67,608 | 10,222 |
| 2016 | 77,676 | 124,953 | 132,268 | 70,125 | 10,533 |
| 2017 | 84,862 | 131,559 | 139,827 | 78,382 | 11,142 |
311 data from NYC Open Data downloaded at various times. As of Feb 5, 2018, 27 million rows, 52 variables till 2009, 53 variables from 2010. Parsed using R v3.4.3 in RStudio v1..1.423

