Slicing and dicing NYC Noise – DEP’s close out time
Number of service requests to NYC’s 311 from 2004 to 2017: 26.99 million
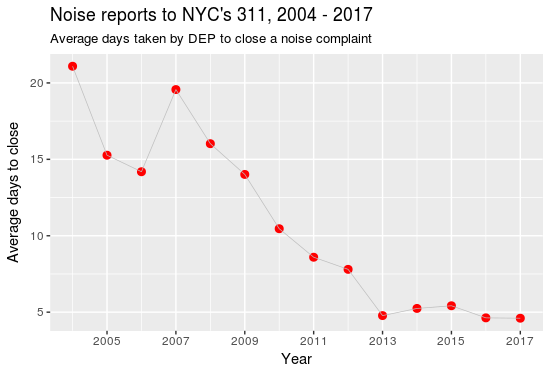
The Department of Environmental Protection (DEP) handled approximately 18% of all noise complaints, numbering about 3.3 million, from 2004 to 2017. Below is a plot that tracks the average number of days it took them to close out a noise complaint that falls in their purview. That includes jackhammer drilling – without a lot of which (thank you? Brookfield) I most likely would never have learnt R to parse 311 data. At any rate, DEP has been averaging about 4 to 5 days the last few years. More than 20 days in year 1. And a steady decline from 2007 to 2013 and they seem to have leveled off since then. Did they get a larger budget to hire more people to address noise more aggressively? Did they go all mob on the construction crews and uh, “silence” them? Ask them @NYCWater – I think they started life handing the city’s water and sewer system and they wound up with everything and the kitchen sink.

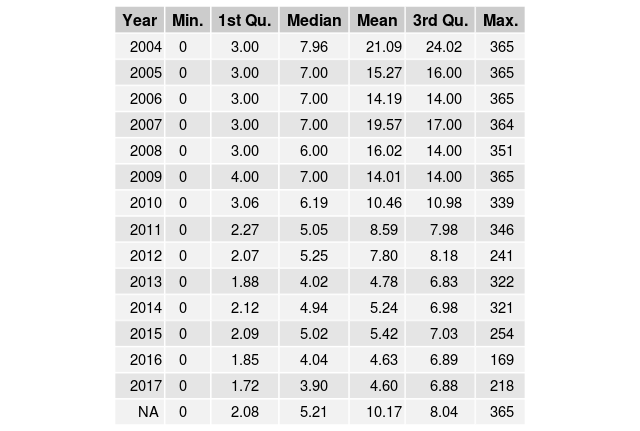
And the summary statistics are in the table below. For those who read my brief explanation about how median and mean interact in the last post – DEP’s is a good example that illustrates the point I make there. The gap between the DEP’s median and mean starts to narrow in 2013; and the gap between the two is unremarkable after that.

311 data from NYC Open Data downloaded at various times. As of Feb 5, 2018, 27 million rows, 52 variables till 2009, 53 variables from 2010. Parsed using R v3.4.3 in RStudio v1..1.423


