Parsing NYPD in 311 data
I wondered how often NYPD “took action to fix the condition” versus all the other options. And, was there any correlation between the ratio of action-taken and action-could-not-be-taken to overall quality of life markers, crime etc? Only one way to find out – keep digging.
Of the 24.54 million complaints to 311 since 2004, 4.02 million got forwarded to NYPD for action. How many complaints per year? The distribution over time? And on and on down an endless list of questions.
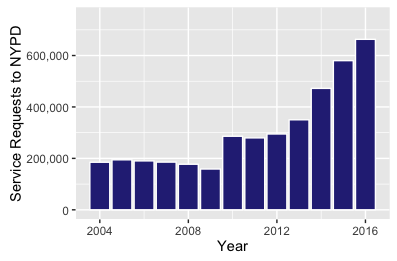
Turns out there is some disagreement on the web about the hex code for “NYPD blue.” At any rate, here are the service requests to 311 sent on to NYPD over the years:

Looks like there was a sharp jump from 2009 to 2010 and a steady and steep rise starting in 2012. Why? Maybe the issues involved in the 311 complaints got worse, maybe complaints that went to a different department now started going to NYPD, maybe a case of “when it works, it works” – people who didn’t complain before start complaining because they think there is a positive outcome from complaining. I will be focusing more on questions that can be answered by the data. Stay tuned.
311 data from NYC Open Data downloaded at various times. As of Feb 19, 2017, 24.5 million rows, 52 variables till 2009, 53 variables from 2010. Parsed using R v3.3.1 in RStudio v1.0.136

